Monitoring
authentik can be easily monitored in multiple ways.
Server monitoring
Configure your monitoring software to send requests to /-/health/live/, which will return a HTTP 200 response as long as authentik is running. You can also send HTTP requests to /-/health/ready/, which will return HTTP 200 if a PostgreSQL connection can be established correctly.
Worker monitoring
The worker container can be monitored by running ak healthcheck in the worker container. This will check that the worker is running and ensure that a PostgreSQL connection can be established correctly.
You can also send HTTP requests to /-/health/ready/, which will return HTTP 200 if a PostgreSQL connection can be established correctly.
Outpost monitoring
Both kinds of outpost (proxy and LDAP) listen on a separate port (9300) and can be monitored by sending HTTP requests to /outpost.goauthentik.io/ping.
Both Docker Compose and Kubernetes deployments use these methods by default to determine when authentik is ready after starting, and to only route traffic to healthy instances; unhealthy instances are restarted.
Metrics
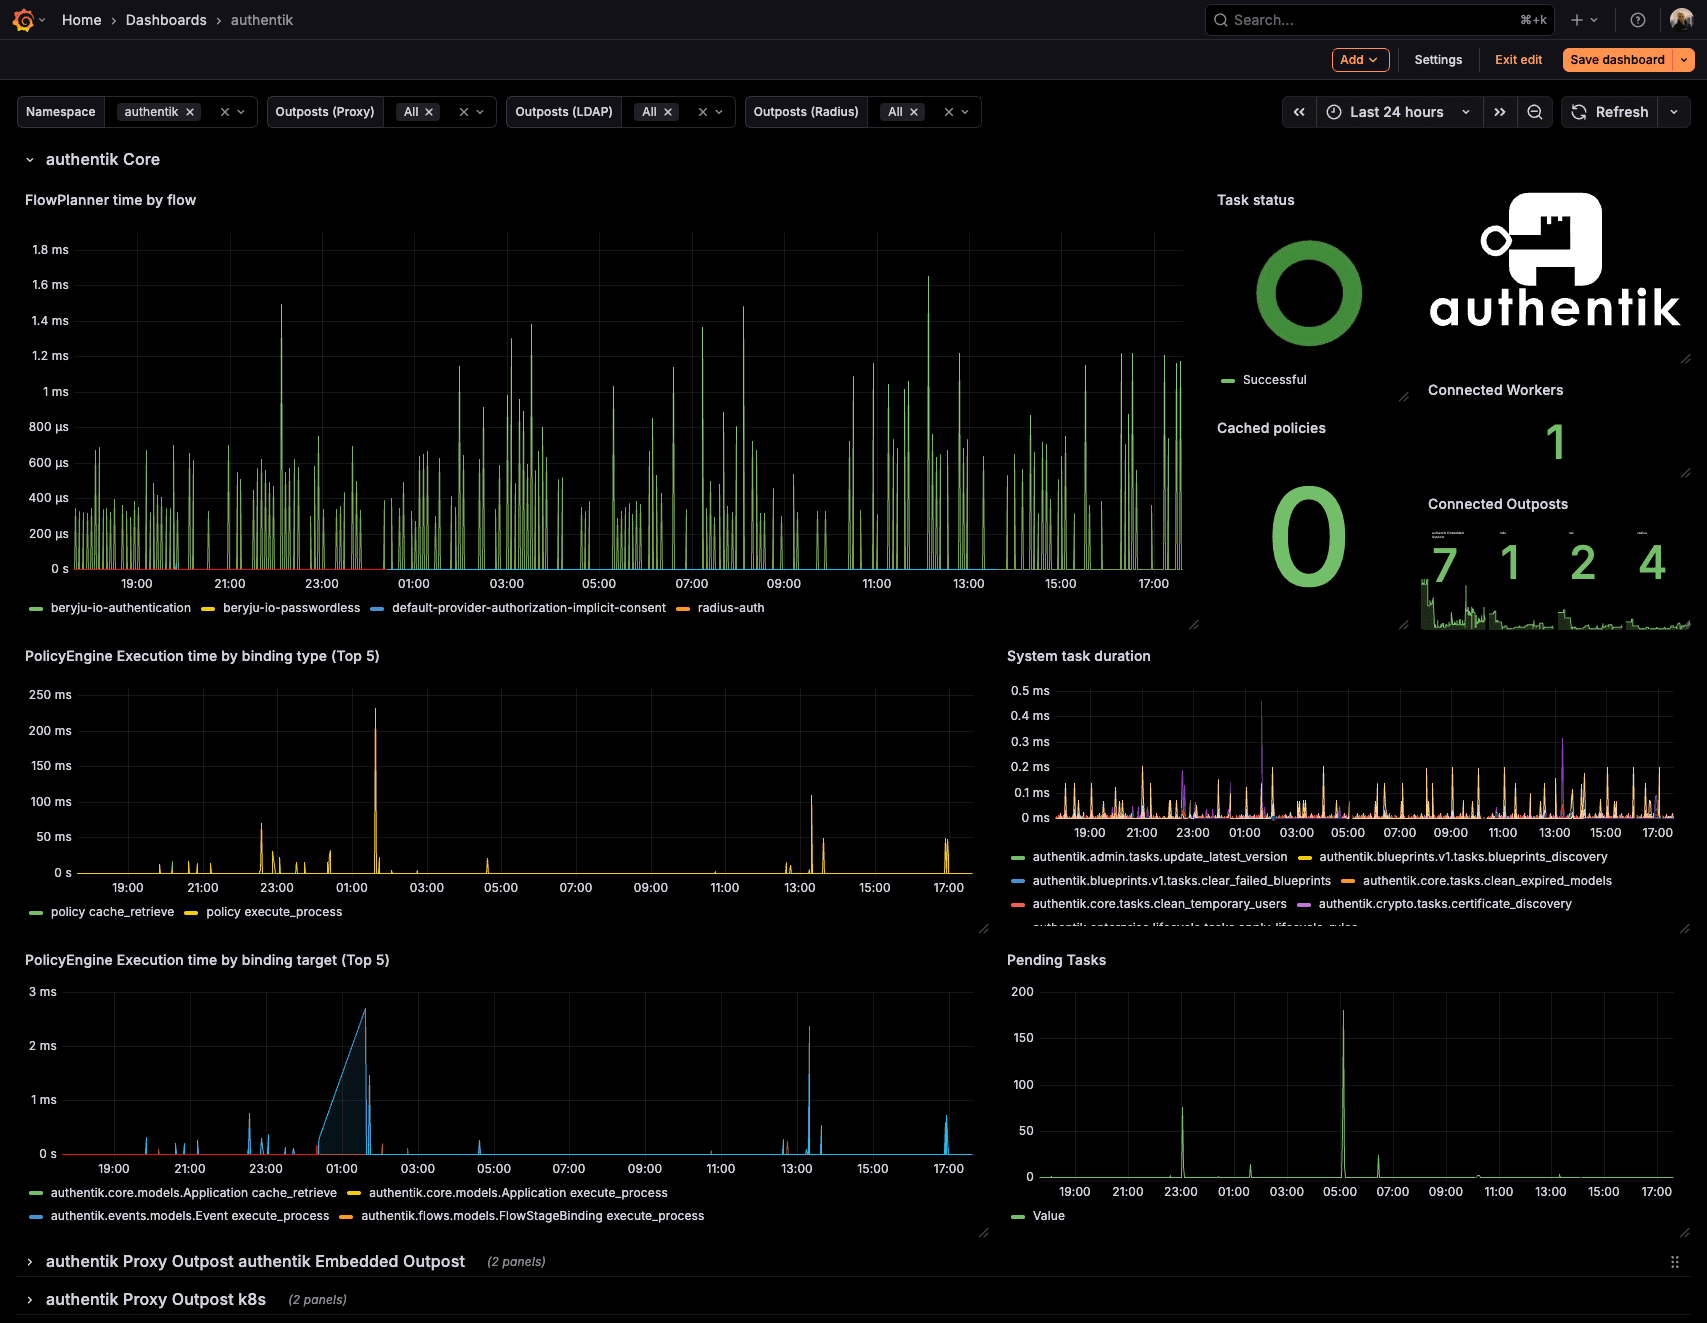
Both the core authentik server, worker and any outposts expose Prometheus metrics on a separate port (9300), which can be scraped to gather further insight into authentik's state. The metrics require no authentication, as they are hosted on a separate, non-exposed port by default.
You can download an example Grafana dashboard.